- Bitcoin’s price dropped by over 6% in the last seven days.
- A few metrics hinted at a market bottom, but indicators suggested otherwise.
Bitcoin [BTC] witnessed a considerable price correction last week, sparking fear among investors. But things might take a U-turn soon, as there were chances of a trend reversal. This seemed to be the case as BTC was mimicking its 2017 price trend.
Bitcoin’s historical trend
Investors didn’t make a profit last week as BTC’s chart remained red. According to CoinMarketCap, BTC was down by more than 6% in the last seven days, pushing its price once again under the $67k mark.
At the time of writing, BTC was trading at $66,896.42 with a market capitalization of over $1.32 trillion.
Meanwhile, Milkybull, a popular crypto analyst, recently posted a tweet highlighting an interesting development. As per the tweet, BTC was mimicking a trend that it followed back in 2017 before beginning a bull rally.
The tweet revealed that BTC’s price was about to reach a market bottom, after which, if history repeats itself, BTC’s price might kickstart a bull rally. Additionally, an indicator was also showing a bullish divergence, just like in 2017.
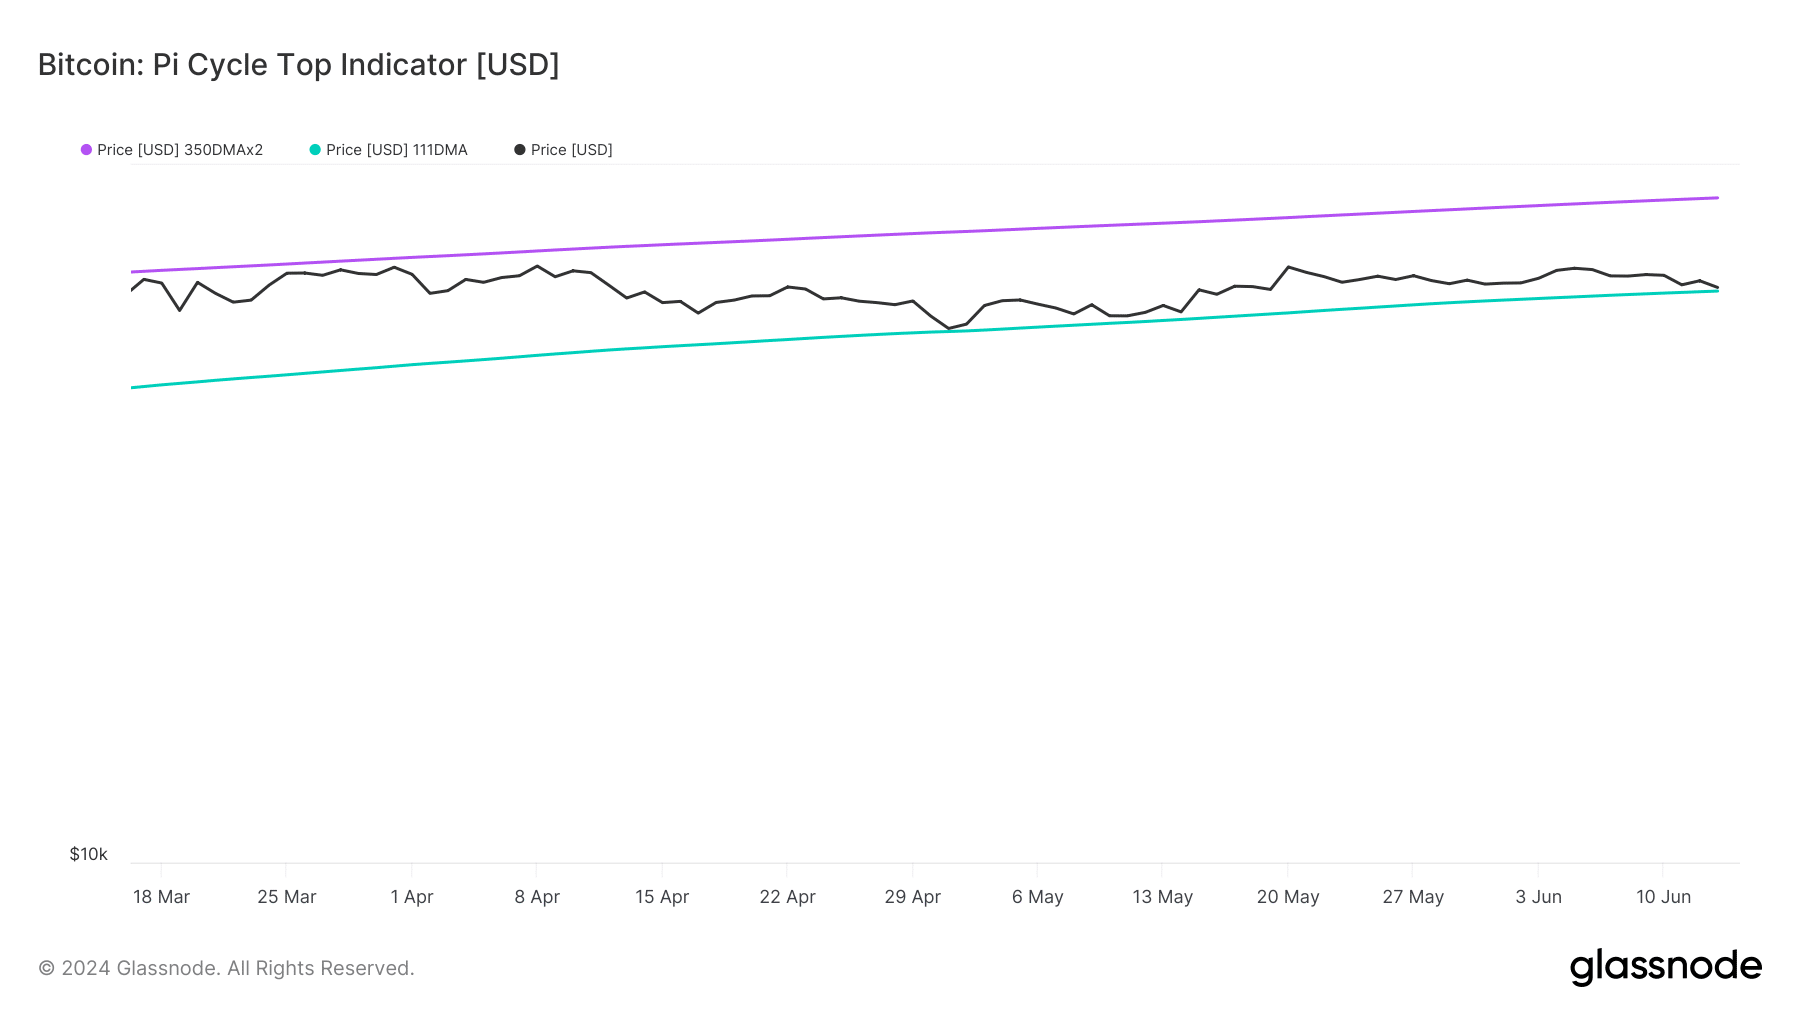
There was even more good news. AMBCrypto’s analysis of Glassnode’s data also revealed a bullish indicator.
According to BTC’s Pi Cycle Top indicator, Bitcoin’s price was resting at its market bottom, and if a trend reversal happens, then it might touch $89k soon.
Is BTC preparing for a rally?
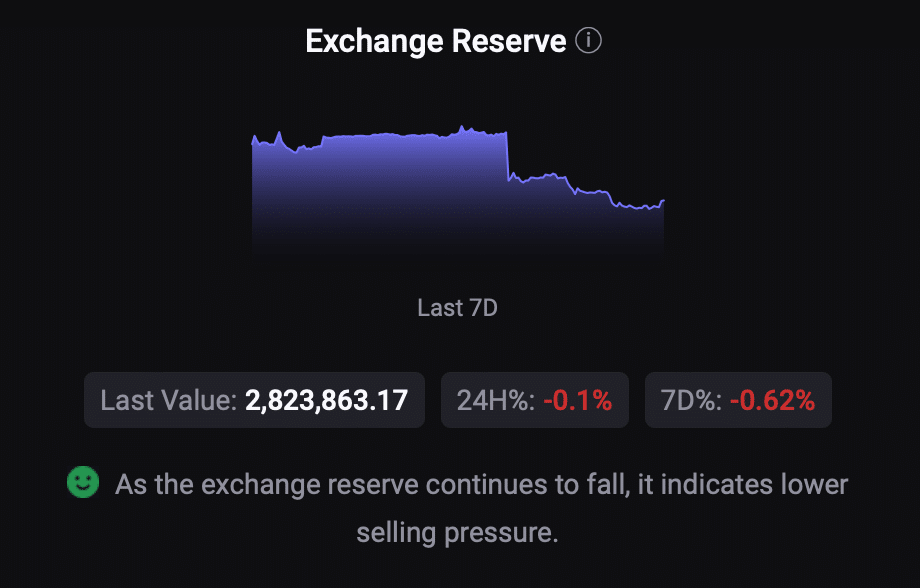
AMBCrypto then checked CryptoQuant’s data to see whether metrics also hinted at a price increase. BTC’s exchange reserve was dropping, meaning that selling pressure on BTC was low.
Its Binary CDD was also green, meaning that long-term holders’ movements in the last seven days were lower than average. They have a motive to hold their coins. However, the rest of the metrics looked bearish.
For instance, BTC’s aSORP suggested that more investors are selling at a profit, which might cause further trouble for BTC’s already bearish price action.
On top of that, BTC’s fear and greed index had a value of 63% at press time, meaning that the market was in a “greed” phase. Whenever the metric reaches this level, it indicates that the chances of a price decline are high.
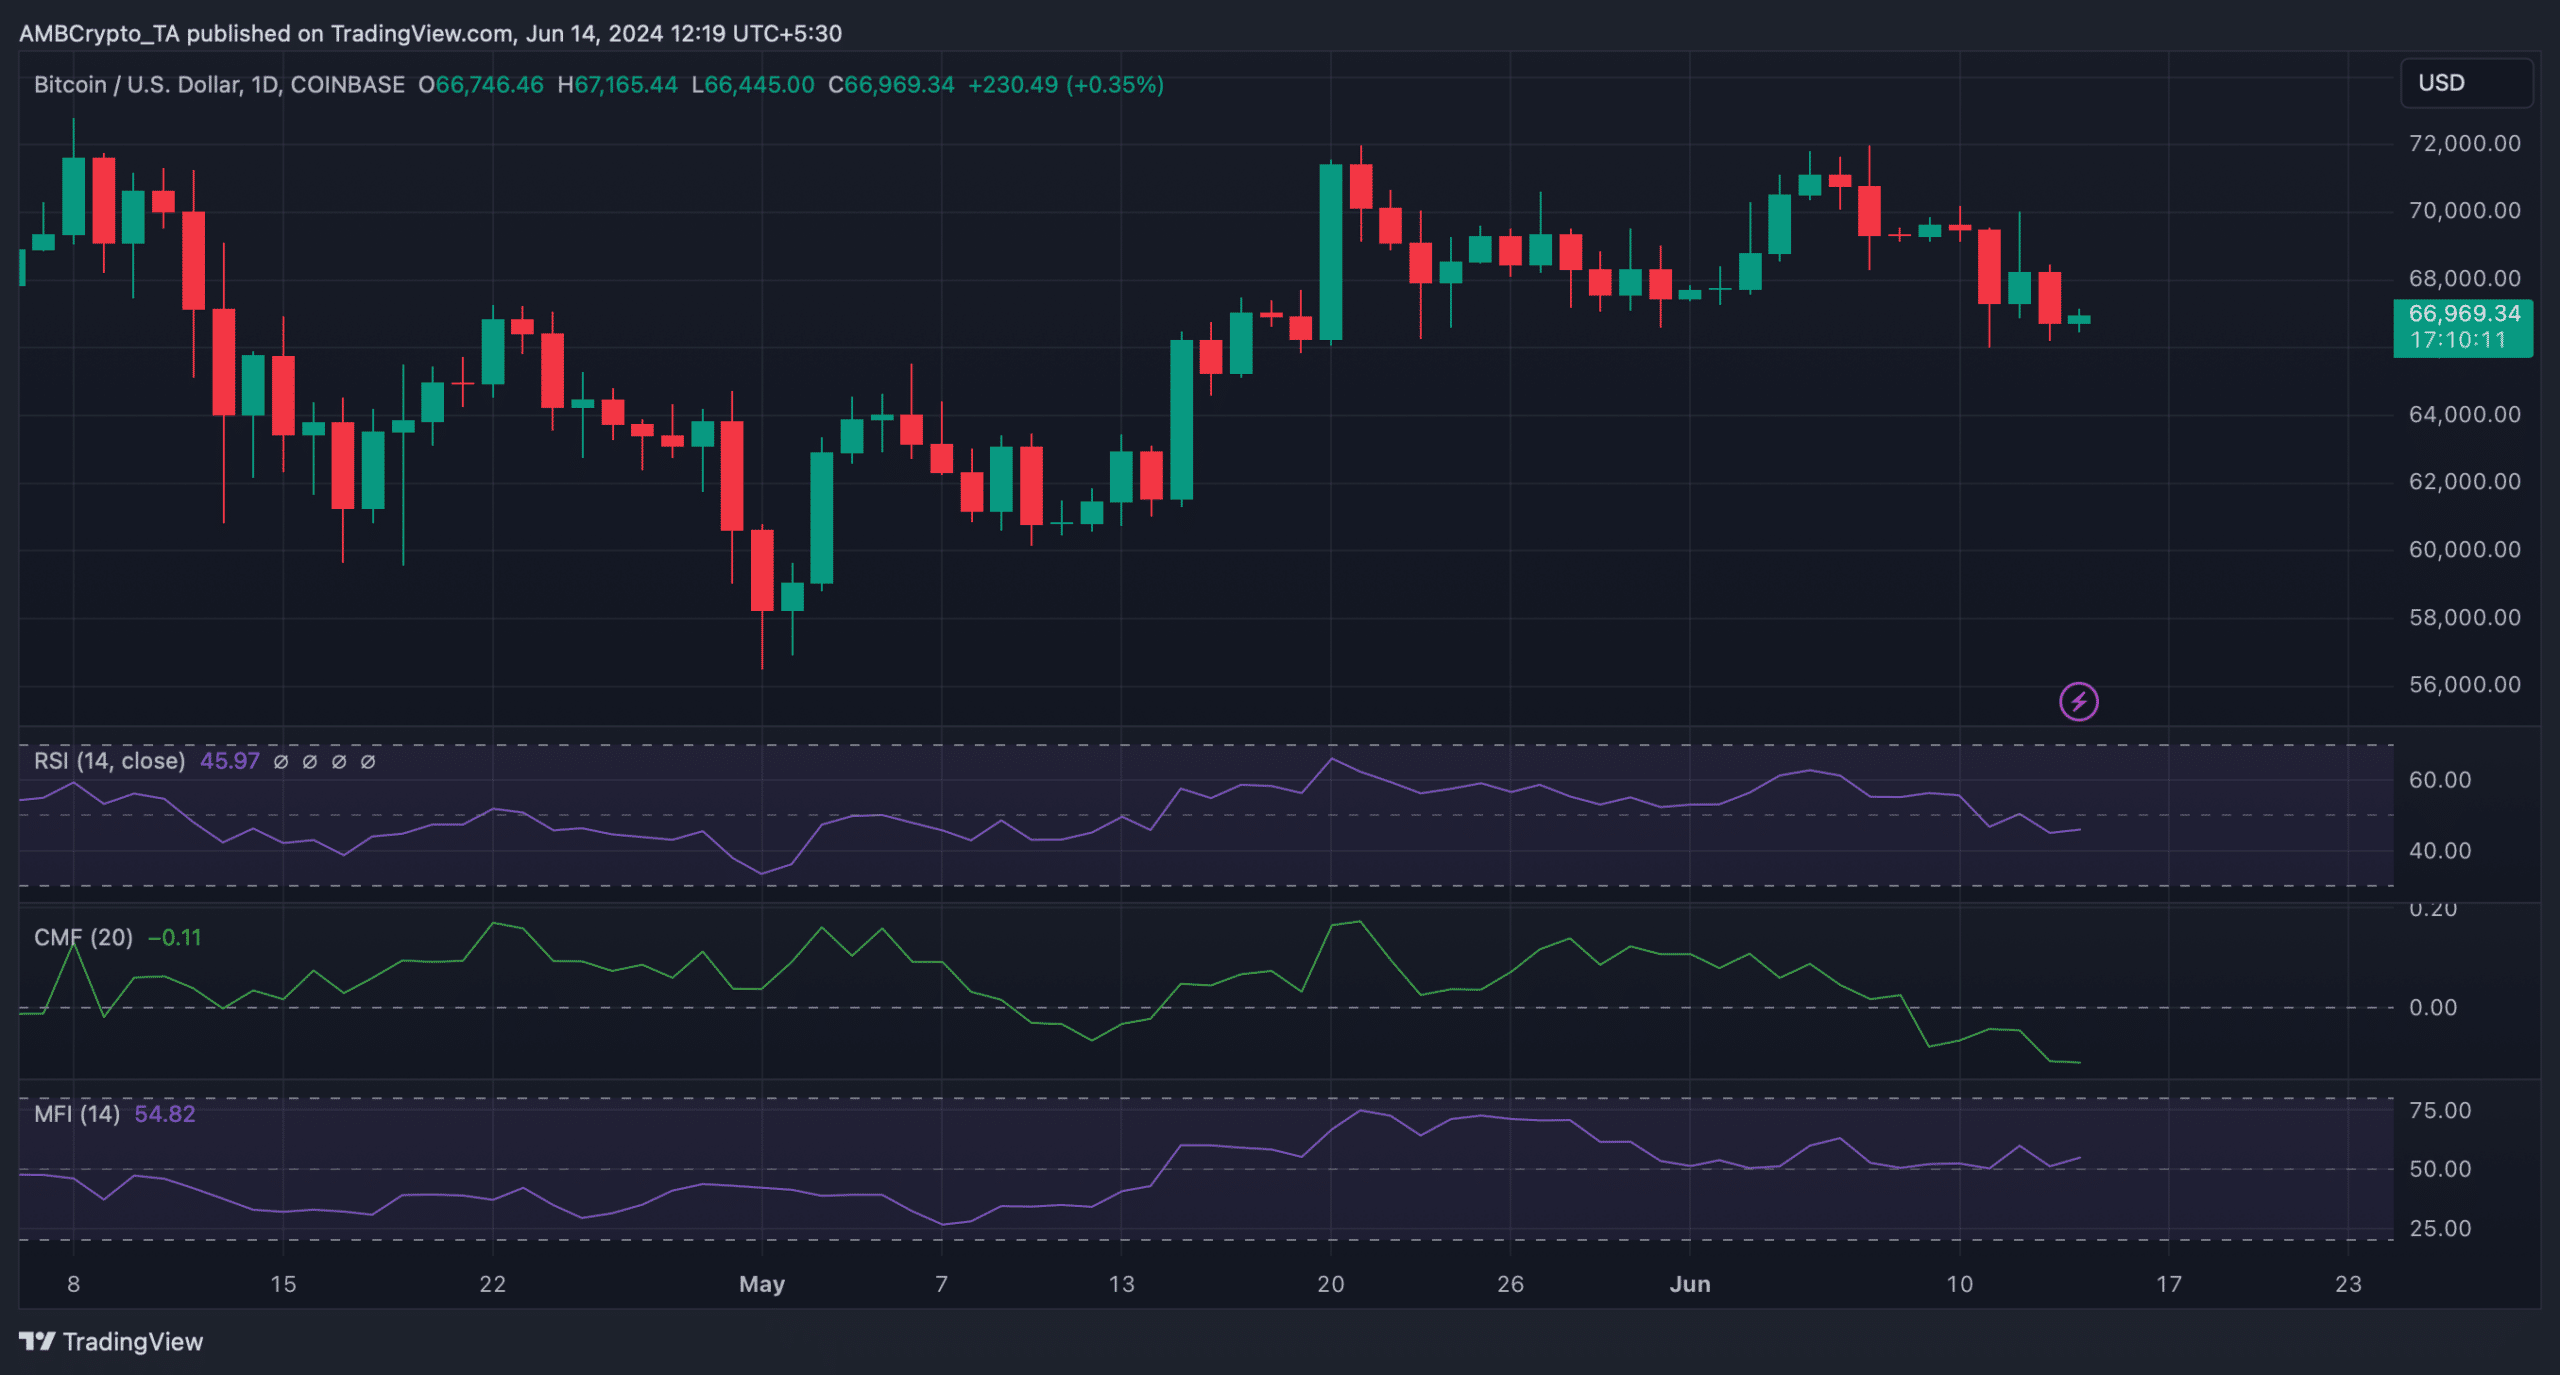
A few of the market indicators also looked pretty bearish. For example, its Chaikin Money Flow (CMF) had registered a sharp downtick.
Read Bitcoin’s [BTC] Price Prediction 2024-2025
Additionally, the Relative Strength Index (RSI) was also resting under the neutral mark, indicating a further price decline.
Nonetheless, the Money Flow Index (MFI) supported the bulls as it moved northwards from the neutral mark.
This article was originally published by a ambcrypto.com . Read the Original article here. .
Disclaimer:The information provided on this website does not constitute investment advice, financial advice, trading advice, or any other sort of advice and you should not treat any of the website’s content as such. BitcoinNews.best does not recommend that any cryptocurrency should be bought, sold, or held by you. Do conduct your own due diligence and consult your financial advisor before making any investment decisions.